Using the AsTTLe tool to facilitate discussions around feedback
|
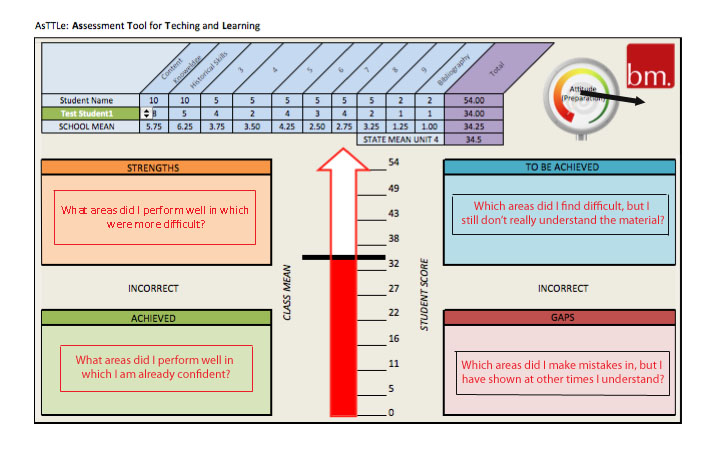
The Feedback Tool (sample shown to the left) can aid in starting feedback discussions with students.
STRENGTHS: Identifies areas in which the student has demonstrated skills and knowledge above expected levels (harder questions). ACHIEVED: Identifies areas in which the student has demonstrates skills and knowledge which is expected for their level (easier questions). |
AsTTLe Feedback Page
|
TO BE ACHIEVED
Areas in which the student has found very difficult, and still is struggling to grasp the concepts, skills or knowledge required (Hard Questions answered incorrectly)
GAPS
These are questions the student has answered incorrectly, however, has made a mistake. These are typically questions in which students have demonstrated previously that they understand, but have made errors/mistakes in the task. (Easy questions answered incorrectly.)
THE BAROMETER
The barometer in the middle of the page compares student performance to that of the class. The black line indicates the class mean (or average), calculated from teacher input. Students can then gauge their performance to that of the class and use this as a guide.
THE TABLE
The Table at the top left of the page breaks down each question/criteria, and allows the student to compare their results to that of the class average. It can help to identify strengths and weaknesses, as well as individual styles of questions in which the student could focus on and set goals for future improvements.
THE GUAGE
The gauge can be used by the teacher and student to discuss how much preparation was completed for the task.
Graphing Results
|
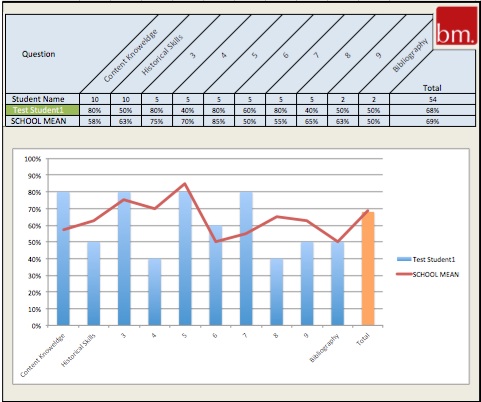
The tool also allows you to break down a student's performance. It breaks down each criteria/question into a percentage, and then compares this to the class average for each criteria and question.
STUDENT FEEDBACK It can help students identify areas for improvement; students may have found the question hard, ran out of time, or made errors in their work. TEACHER FEEDBACK The Graphed Results page can also allow teachers to gain an idea into aspects of the task which may have been difficult for students to complete. Interpreting the School/Class Mean data, teachers can get a quick snapshot into questions/criteria that a class may have found much more difficult to complete, due to any number of reasons. |
Graphed Results Page
|
Background to AsTTLe
e-AsTTLe is an internet based system in New Zealand for Maths, Reading and Writing in Years 4-8. It uses tests to help formatively and summatively for students and teachers alike. The feedback page was developed using the e-AsTTLe student feedback page as a base.
More information about these tests can be found at the links below
More information about these tests can be found at the links below
- http://www.jisc.ac.uk/media/documents/projects/asttle_casestudy.pdf
- http://e-asttle.tki.org.nz/
